Pythonでナイキスト線図を描く方法について入門者向けにまとめました。
ナイキスト線図を描く
Pythonでは、scipyモジュールの「signal.ZerosPolesGain」「signal.freqresp」メソッドでナイキスト線図を作成できます。
サンプルコード
サンプルプログラムのソースコードです。
(1) 
# -*- coding: utf-8 -*-
from scipy import signal
import matplotlib.pyplot as plt

# 伝達関数の定義
G = signal.ZerosPolesGain([2, 1], [2, 3, 1], 2)

# ナイキスト線図の計算
w, H = signal.freqresp(G)

# グラフ化
plt.figure()
plt.plot(H.real, H.imag, "b")
plt.plot(H.real, -H.imag, "r")
plt.grid()
plt.show()
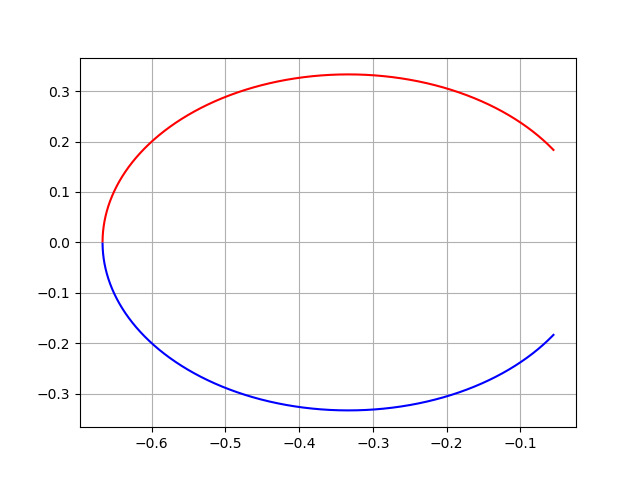
実行結果
サンプルプログラムの実行結果です。
| – | 関連記事 |
|---|---|
| 1 | Pythonで制御工学シミュレーション |
| 2 | Python入門 サンプル集 |
コメント